
What Is Conversion Rate Optimisation (CRO)? A Complete Guide (2026)
 Jignesh Vagadiya
20/08/2026
22 min read
Jignesh Vagadiya
20/08/2026
22 min read
Most businesses find out their conversion rate is a problem the expensive way — after months of pumping more traffic into a site that was never going to convert it. Conversion rate optimisation (CRO) is the discipline of fixing that leak before you spend another dollar chasing clicks. Done properly, it’s not a single project with a start and end date; it’s an ongoing, evidence-led process of understanding why visitors don’t take action, forming testable hypotheses about what might change that, and validating those hypotheses with controlled experiments rather than opinions. This guide covers what CRO actually involves — the research, the maths, the testing discipline, and the tactics — so you can either run it properly in-house or know exactly what you should be paying an agency for.
What Conversion Rate Optimisation Actually Is (And Isn’t)
Conversion rate optimisation is the structured process of increasing the percentage of website visitors who complete a desired action — a purchase, a form submission, a phone call, a demo booking — without necessarily increasing traffic. It sits at the intersection of data analysis, user psychology, design and statistics. The output isn’t a redesigned website; it’s a system for continuously learning what your visitors need in order to act, and removing the friction that stops them.
It’s not just A/B testing button colours
This is the misconception that does the most damage, because it’s the one that gets CRO written off as fluff. Somewhere along the way, “optimisation” became shorthand for swapping a red button for a green one and calling it a win. Colour, copy and layout tweaks are legitimate test variables, but they’re the smallest, lowest-leverage part of the discipline. Real CRO work spends most of its time upstream of any test: pulling analytics data apart to find where visitors actually drop off, watching session recordings to see where they hesitate, running user testing to hear where they get confused, and only then forming a hypothesis worth testing. A button colour test run without that groundwork is a guess wearing a lab coat.
The tactics that move conversion rate meaningfully are usually structural — rewriting a value proposition that isn’t landing, removing a form field that’s costing you a third of your leads, restructuring a checkout flow that has too many decision points, or fixing page speed on mobile because half your traffic is bouncing before the page even renders. Colour and copy micro-tests matter, but they’re refinements on top of decisions that were already validated with research.
CRO is a system, not a one-off project
The other misconception is treating CRO as a fixed-scope engagement — run a few tests, ship the winners, done. Conversion rate optimisation only compounds when it’s run as a continuous loop: research feeds hypotheses, hypotheses get prioritised and tested, results feed back into research, and the cycle repeats. A site that ran three tests two years ago and stopped isn’t “doing CRO” — it ran a small experiment. The businesses that see the biggest cumulative gains are the ones that treat their conversion rate the way they treat SEO rankings or ad performance: a number that’s actively managed every month, not a project that gets finished.
How to Calculate and Benchmark Your Conversion Rate
Before you can optimise a number, you need to be measuring it correctly — and this is where a lot of businesses go wrong before they’ve even started.
The conversion rate formula
The base formula is simple: conversion rate equals the number of conversions divided by the number of visitors (or sessions), multiplied by 100. If 4,000 people visit your site in a month and 92 of them complete a purchase or submit an enquiry form, your conversion rate is 2.3%. The complexity isn’t in the maths — it’s in defining what counts as a conversion, and at what point in the funnel you’re measuring it. A single “overall site conversion rate” is a vanity number unless you segment it: by traffic source, by device, by landing page, and by new versus returning visitor. A site converting at 3% overall might be converting at 5% on desktop and 1.1% on mobile — and that gap is where the actual opportunity lives.
What counts as “good” — and why the average is a trap
Industry-wide, the average website conversion rate sits somewhere around 2–3%, with the top quartile of sites converting north of 5%, and the top 10% pushing past 11%. Those numbers get quoted constantly, and they’re almost useless in isolation, because conversion rate varies enormously by industry, traffic source, average order value and funnel length. A B2B software company selling a $40,000/year contract will have a dramatically lower “conversion” rate on a demo-request form than an ecommerce store selling a $35 product, and that’s not a sign either business is underperforming — it’s a reflection of how much friction and consideration sits between “visitor” and “action.”
The benchmark that actually matters is your own historical baseline, and, where you can get it, a benchmark against direct competitors or close industry comparables. Set your target against where you were last quarter, not against an average pulled from a report covering a hundred different verticals. If your current conversion rate is 1.4% and the industry average is 2.5%, that tells you there’s probably room to move — but the specific gains come from your own funnel data, not the benchmark.
Ecommerce vs lead-gen benchmarks are genuinely different games
Ecommerce conversion rate is typically measured as completed purchases over sessions, and tends to sit lower than lead-gen because the visitor is handing over money on the spot. Lead-generation conversion rate — form fills, calls, bookings — is usually higher as a raw percentage because the “cost” to the visitor is lower (an email address, not a credit card), but the lead still has to be qualified and closed downstream, which is a different funnel with its own drop-off. Comparing an ecommerce store’s 2.1% purchase rate against a lead-gen site’s 6% form-fill rate and concluding one business is “better at CRO” than the other is comparing two different sports. We’ll come back to how the tactics diverge further down.
The CRO Research Process
This is the part of CRO that gets skipped most often, and it’s the part that separates a program that compounds from one that’s just running random tests. Good research draws on both quantitative data (what’s happening) and qualitative data (why it’s happening) — you need both, because numbers tell you where the leak is and people tell you why it’s leaking.
Analytics data: finding where visitors actually drop off
Start with your analytics platform — GA4 for most sites — and build out funnel visualisation reports for your key conversion paths. You’re looking for the specific step where the biggest percentage of visitors exits: is it the product page, the cart, the shipping-details step, or the payment step? Segment this by device and by traffic source, because a drop-off that’s brutal on mobile paid traffic might be a non-issue on desktop organic. Look at page-level engagement metrics too — time on page, scroll depth, exit rate on high-traffic landing pages — to flag pages that are technically “converting” some visitors but leaking most of them before any message even lands. This is quantitative groundwork: it tells you where to look, not why it’s happening.
Heatmaps and session recordings
Tools like Hotjar, Microsoft Clarity or Crazy Egg let you watch anonymised recordings of real visitor sessions and generate heatmaps showing where people click, how far they scroll, and where their mouse hovers (a reasonable proxy for where their eyes are). This is where the “why” starts to surface. You’ll often see patterns quantitative data alone can’t show — visitors repeatedly clicking on an element that isn’t actually a button, scrolling straight past your primary call-to-action because it’s below a distracting hero section, or rage-clicking a form field that isn’t validating correctly. Watching twenty to thirty session recordings of visitors who didn’t convert on a specific page is one of the highest-value hours you can spend in a CRO process.
User testing
Heatmaps show behaviour; user testing tells you what someone was thinking while they did it. Recruiting a handful of people who match your target audience and having them attempt a task on your site — “find and buy this product,” “request a quote for this service” — while narrating their thoughts out loud, surfaces friction that no amount of data-mining will find. This is where you discover that your pricing page reads as confusing rather than premium, or that your value proposition is being misread entirely. Five to eight sessions is usually enough to see the same friction points repeat.
Surveys and on-site polls
On-site exit-intent surveys (“what stopped you from completing your purchase today?”) and post-purchase surveys (“what almost stopped you?”) give you direct, low-effort qualitative input at scale that user testing can’t match for volume. They’re blunter than moderated user testing — you’ll get some noise — but when the same objection shows up in fifty survey responses (price, shipping cost, trust, lack of information), that’s a hypothesis writing itself.

Forming and Prioritising Hypotheses
Once research surfaces problems, the temptation is to jump straight to “let’s test it.” Resist that. A structured hypothesis and a prioritisation framework are what stop a CRO program turning into a scattergun of tests that never build on each other.
Writing a hypothesis that’s actually testable
A proper CRO hypothesis has three parts: the change, the expected effect, and the reasoning tying them together. The format we use is: “If we [change], then [metric] will [improve/decrease], because [evidence from research].” For example: “If we move the shipping-cost disclosure from the final checkout step to the product page, then cart abandonment will decrease, because 40% of exit-survey respondents cited ‘unexpected costs at checkout’ as their reason for leaving.” Notice that hypothesis is grounded in a specific piece of research, not a hunch. “Let’s try a green button” isn’t a hypothesis — it’s a guess with no evidence behind it and no clear reason to expect a particular outcome.
ICE scoring: fast prioritisation
When you’ve got a backlog of ten or twenty hypotheses (which happens fast once research is underway), you need a way to decide what to test first. ICE scores each hypothesis on three factors, usually 1–10:
- Impact — how much would this move the needle if it works?
- Confidence — how sure are you, based on the research, that it will work?
- Ease — how much effort and engineering time does it take to build and test?
Multiply or average the three scores and rank your backlog by the result. ICE is fast and subjective — it’s a gut-check framework, useful for smaller teams moving quickly, but it leans heavily on whoever’s scoring it, so it works best when a few people score independently and compare notes rather than one person guessing alone.
PIE scoring: a slightly more rigorous alternative
PIE scores Potential (how much room for improvement exists on this page), Importance (how much traffic or revenue does this page carry), and Ease (same as ICE). It’s marginally more structured than ICE because “Potential” and “Importance” force you to look at actual traffic and conversion data for the page in question rather than a general impact guess. Neither framework is objectively “correct” — pick one, apply it consistently across your backlog, and use it to justify why you’re testing the checkout page before the blog sidebar, not the other way around.
A/B Testing Methodology (and the Number One Mistake)
This is where CRO lives or dies on discipline. You can do flawless research, write a sharp hypothesis, and still generate a completely wrong conclusion if the test itself isn’t run and read correctly.
Sample size and statistical significance
An A/B test splits traffic between a control (the current page) and a variant (your hypothesis), then measures which converts better. The result is only trustworthy once you’ve reached statistical significance — the point where the difference between variants is unlikely to be down to random chance. Significance depends on sample size (how many visitors have gone through the test) and effect size (how big the difference between variants actually is). Low-traffic pages take much longer to reach a valid sample than high-traffic ones, which is exactly why testing a subtle headline tweak on a page that gets forty visitors a day is close to a waste of time — it could take months to reach a reliable read, if it ever does.
Before running a test, calculate the sample size you’ll need using your current conversion rate, the minimum detectable effect you care about, and a 95% confidence threshold (the standard used across the industry). Most testing platforms, and free online sample-size calculators, will do this maths for you — the point is to know the number before you start, not to eyeball it once the test is live.
Why reading results too early is the single biggest mistake in CRO
This is the mistake that quietly wrecks more CRO programs than anything else. Early in a test, small sample sizes produce wide, unstable swings — a variant can show a 30% lift on day two purely from noise, and that lift will keep moving, sometimes reversing entirely, as more data comes in. Teams that check results daily and call a winner as soon as they see a promising number are, more often than not, reacting to statistical noise rather than a real effect. The fix is procedural, not clever: decide your required sample size and minimum test duration before the test starts, and don’t look at the result as a decision point until both are met — checking in on the test to make sure nothing is broken is fine, calling a winner early is not.

Test duration and business cycles
Beyond raw sample size, run every test for at least one full business cycle — a minimum of one to two full weeks, so you capture both weekday and weekend behaviour, which often differ substantially in purchase intent and browsing patterns. For businesses with monthly cycles (payday-driven purchasing, B2B budget cycles, seasonal categories), a two-week test can still miss a meaningful chunk of your buyer variety. Stopping a test the moment it crosses a significance threshold, if that happens after three days, still risks a result skewed by whichever segment of your audience happens to be active that particular week. Patience here is the difference between a real, repeatable lift and a number that quietly evaporates the following month.
Landing Page and Checkout-Specific CRO Tactics
With the process and discipline covered, here’s where that process typically points once you start applying it — the tactics that show up again and again across research findings, split by where in the funnel they apply.
Landing page tactics
The highest-leverage landing page changes are usually about clarity and speed, not decoration. A value proposition that answers “what is this, who is it for, and why should I care” within the first screen, without requiring a scroll, consistently outperforms clever-but-vague headlines. Page load speed is a conversion factor in its own right — every additional second of load time on mobile measurably increases bounce rate, which means a genuinely fast page is a CRO tactic before a single word of copy changes. Reducing above-the-fold clutter, using a single primary call-to-action rather than three competing ones, and matching landing page messaging tightly to the ad or search query that brought the visitor there (message match) all show up repeatedly as reliable levers. This is also where conversion-focused design work earns its keep — the layout, hierarchy and visual flow of a page are doing a measurable share of the persuasive work before copy is even read.
Checkout and cart tactics for ecommerce
Cart abandonment is where ecommerce CRO concentrates most of its effort, because the visitor has already shown strong intent — they’ve added a product — and something in the final steps is still talking them out of it. Surfacing shipping costs and delivery timeframes earlier in the journey rather than as a surprise at the final step removes the single most commonly cited abandonment reason. Offering a guest checkout option (not forcing account creation) reduces friction meaningfully. Minimising form fields, showing trust signals (security badges, clear returns policy) at the point of payment, and offering multiple payment methods all reduce the number of small hesitations that compound into an abandoned cart. Progress indicators on multi-step checkouts reduce perceived effort even when actual effort hasn’t changed.
Lead-generation form tactics
For lead-gen sites, the form itself is usually the highest-friction moment. Every additional field measurably reduces completion rate — the discipline here is asking only for what you genuinely need to qualify or follow up on a lead, and deferring anything else to a later stage of the sales process. Multi-step forms that break a long form into smaller, less intimidating chunks often outperform a single long form, even though the total number of fields hasn’t changed — perceived effort matters as much as actual effort. Clear, specific calls-to-action (“Get a free quote” rather than “Submit”) and visible trust indicators near the form (client logos, review scores, a direct phone number) reduce the hesitation that shows up repeatedly in session recordings right before someone abandons a form.
CRO for Ecommerce vs Lead Generation: Different Games, Different Tactics
We touched on the benchmark gap earlier; the tactical gap is just as real, because the two models have fundamentally different conversion events and different amounts of consideration behind them.
Ecommerce conversion happens in a single session, often on a single visit, with the full transaction — including payment — completed on-site. That means ecommerce CRO concentrates on product pages, cart, and checkout, and success metrics extend beyond conversion rate alone to average order value and revenue per visitor, because a 2% conversion rate at a $150 average order is worth more than a 3% conversion rate at a $40 average order. Cross-sell and upsell placement, product imagery and reviews, and checkout friction dominate the tactical list.
Lead generation conversion is the first step of a longer, often offline, sales process — the “conversion” being measured on-site (a form fill or a call) isn’t the final business outcome, a closed deal is. That means lead-gen CRO has to think one step further than the form submission: a spike in raw form fills that’s actually dragging in unqualified leads isn’t a genuine win if your sales team is now wasting hours on prospects who were never going to buy. Lead-gen CRO tactics therefore lean more heavily on qualification — smart form fields, clear pricing or eligibility information upfront, and content (case studies, FAQs) that pre-sells and pre-qualifies before the enquiry even lands. The metric that matters most isn’t raw conversion rate; it’s conversion rate of qualified leads, tracked through to close where possible.
How CRO Compounds With Paid Traffic
This is the piece that gets underweighted most often, because CRO and paid media tend to sit in different budgets and sometimes different teams — but the maths here is direct and worth putting in front of whoever owns the ad spend.
Cost per acquisition (CPA) is a function of cost per click and conversion rate. If your conversion rate improves by 20% and your traffic, spend and click cost stay exactly the same, your CPA drops by roughly 20% — you’re generating the same number of extra customers you would have gotten from a 20% budget increase, without spending an extra dollar on media. Run that the other way: if you’re evaluating whether to put another $10,000 a month into Google Ads or Meta Ads versus investing that same budget into CRO on your existing traffic, a genuine conversion rate lift on your current volume is very often the cheaper, more durable path to the same revenue outcome — and unlike an ad spend increase, the lift persists after the CRO work is done. We go deeper into the CPA and efficiency side of this in our guide to measuring Google Ads ROI, and the underlying formulas — CPA, ROAS, conversion rate as a paid metric — are broken down in our PPC formulas and metrics guide; this article is the practical follow-through on actually moving that conversion rate number once you know what it’s costing you.
There’s a compounding effect too: a higher conversion rate improves the quality signals platforms like Google and Meta use for algorithmic bidding, which can lower cost per click over time as the algorithm learns your traffic converts well — meaning the CRO lift doesn’t just reduce CPA on its own, it can improve the underlying media efficiency that CPA is calculated from. This is one of the clearer arguments for running CRO and analytics work alongside paid media rather than treating them as separate line items competing for budget.
Common CRO Mistakes
- Testing without research. Jumping straight to A/B testing based on a hunch or a competitor’s homepage, skipping the analytics and behavioural research that should generate the hypothesis in the first place.
- Calling a winner before reaching significance. Ending a test early because the variant is “clearly winning” on day two or three, when the sample size hasn’t come close to a reliable threshold.
- Testing too many variables at once. Changing the headline, the hero image and the call-to-action button in the same variant makes it impossible to know which change actually drove the result.
- Ignoring statistical power on low-traffic pages. Running a formal A/B test on a page that gets a handful of visitors a day, when qualitative research or a simple direct change would get to an answer faster and more reliably.
- Optimising a metric that doesn’t tie to revenue. Chasing a higher click-through or form-fill rate that pulls in a worse-fit audience, inflating a vanity metric while quality — and downstream revenue — quietly drops.
- Treating CRO as a one-off project. Running a handful of tests, shipping the winners, and then stopping — rather than feeding results back into ongoing research and treating the conversion rate as a number that’s actively managed every month.
- Copying “best practice” without validating it locally. A tactic that worked on one site (a specific button colour, a specific form length) doesn’t automatically transfer — every audience and funnel is different, and “best practice” is a starting hypothesis, not a guaranteed result.
Frequently Asked Questions
How long does it take to see results from CRO?
Meaningful, statistically valid results from an individual test typically take two to four weeks depending on your traffic volume, since you need both a sufficient sample size and a full business cycle to trust the result. As a program, most businesses start seeing a measurable uplift in overall conversion rate within the first two to three months, once several validated wins have been implemented and the research process has surfaced the highest-impact opportunities.
What’s a realistic conversion rate improvement to expect?
It depends heavily on your starting point — a site that’s never had any CRO work done typically has more low-hanging fruit than one that’s already been through several rounds of testing. As a rough guide, a well-run first six months of CRO often delivers a 10–30% relative improvement in conversion rate, though sites with significant unaddressed friction (slow load times, confusing checkout, weak value proposition) can see considerably more.
Do I need a certain amount of traffic before CRO is worth doing?
Formal A/B testing needs enough traffic to reach statistical significance in a reasonable timeframe, which generally means at least a few hundred conversions a month on the page or flow you’re testing. Below that, CRO is still worth doing — you just lean more heavily on qualitative research (session recordings, user testing, surveys) and direct, evidence-based changes rather than split testing every decision.
What tools do I need to run CRO properly?
At minimum: an analytics platform (GA4) correctly configured with conversion tracking and funnel visualisation, a heatmap and session recording tool (Hotjar or Microsoft Clarity are common starting points), and an A/B testing platform capable of statistically valid split testing. Survey and user-testing tools are useful additions but not strictly required to get started — the core three above cover most of the research and validation loop.
Is CRO different for ecommerce and lead-generation businesses?
Yes, meaningfully. Ecommerce CRO concentrates on product pages, cart and checkout, with the full transaction completed on-site, and success is measured through conversion rate alongside average order value and revenue per visitor. Lead-generation CRO has to look past the on-site conversion event (a form fill or call) to lead quality and eventual close rate, since the on-site action is only the first step of an often-offline sales process.
How does CRO affect my paid advertising costs?
Directly. Cost per acquisition is a function of cost per click and conversion rate, so a genuine conversion rate improvement lowers your CPA at the same spend level — a 20% lift in conversion rate is roughly equivalent to a 20% cheaper CPA. It can also improve the quality signals paid platforms use for algorithmic bidding, which may reduce cost per click over time as well.
Where to Start
If you’re starting from zero, don’t open with a test — open with the research. Get your analytics tracking configured properly and build out a funnel report for your primary conversion path, install a heatmap and session recording tool on your highest-traffic pages, and spend a few hours actually watching how real visitors move through your site before you write a single hypothesis. That groundwork alone usually surfaces two or three clear, evidence-backed opportunities worth testing — and it costs nothing but time.
From there, prioritise with ICE or PIE, run your first test with a proper sample-size calculation in hand, and resist the pull to call a winner early. If you’d rather have this process run for you — research, prioritisation, testing and the ongoing loop — that’s exactly what our analytics and CRO service is built around, and our pricing page has a straightforward breakdown of what that looks like at different levels of engagement. Either way, the discipline matters more than the tooling: a conversion rate that’s actively, methodically managed will keep compounding long after any individual test is forgotten.
Keep reading
Related posts
Best Analytics and Reporting Tools After GA4 for Australian Businesses (2026): 6 Compared
Six analytics and reporting tools to use alongside or instead of GA4, compared for Australian businesses on cost, privacy, data location and…
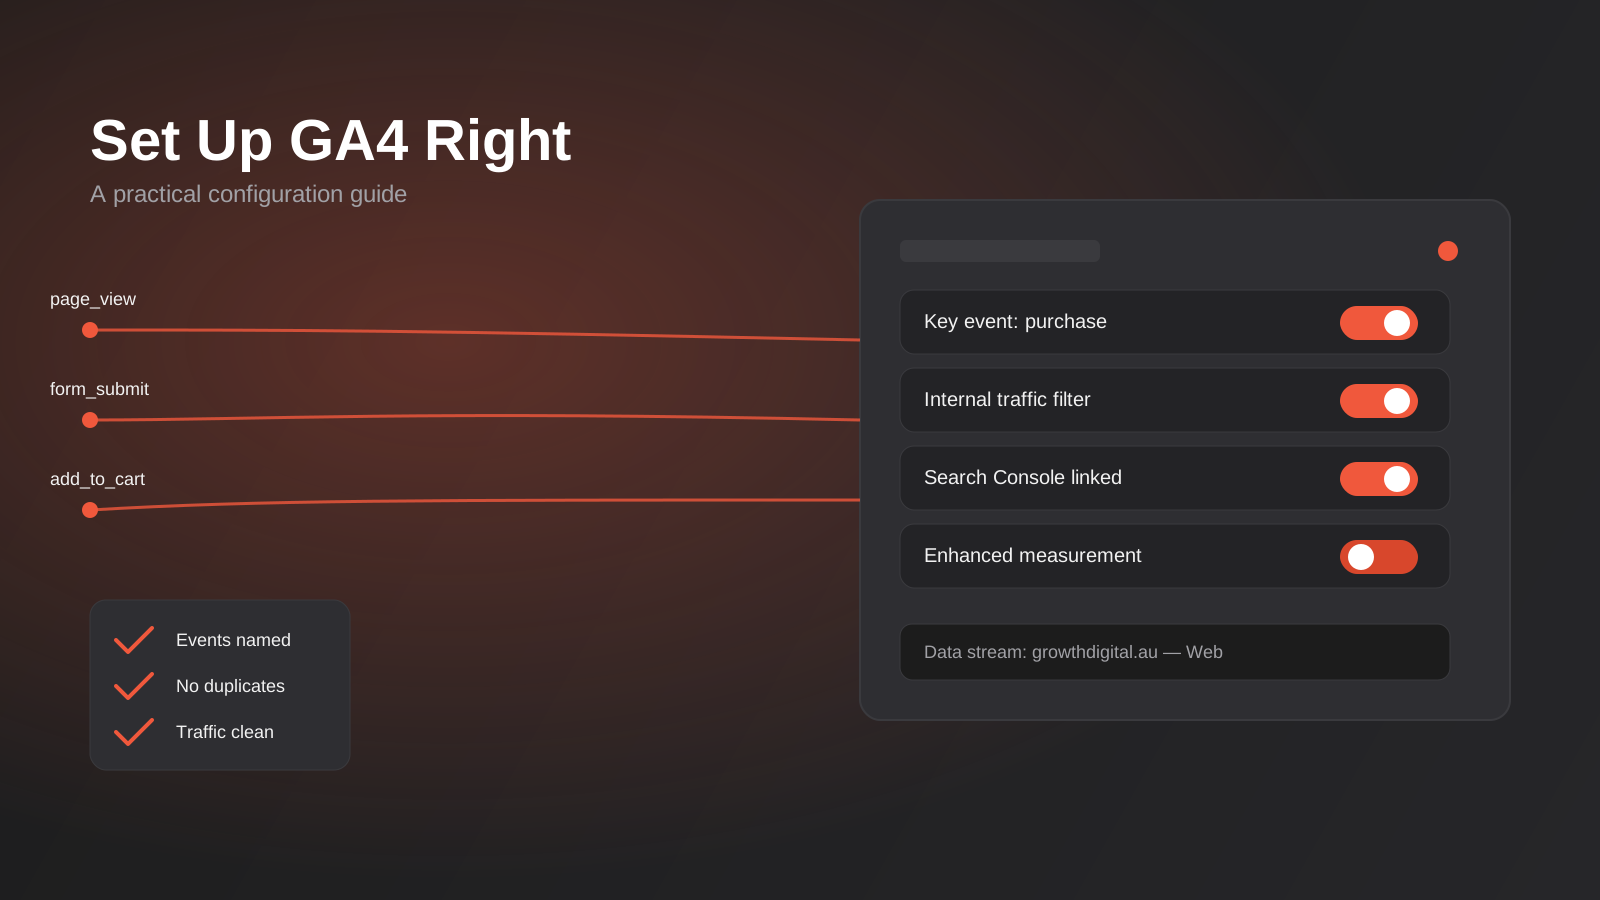
Google Analytics 4 Setup: A Practical Configuration Guide for Australian Businesses (2026)
A practical GA4 setup guide for Australian businesses: events, key events, filters and the mistakes that quietly corrupt your data.
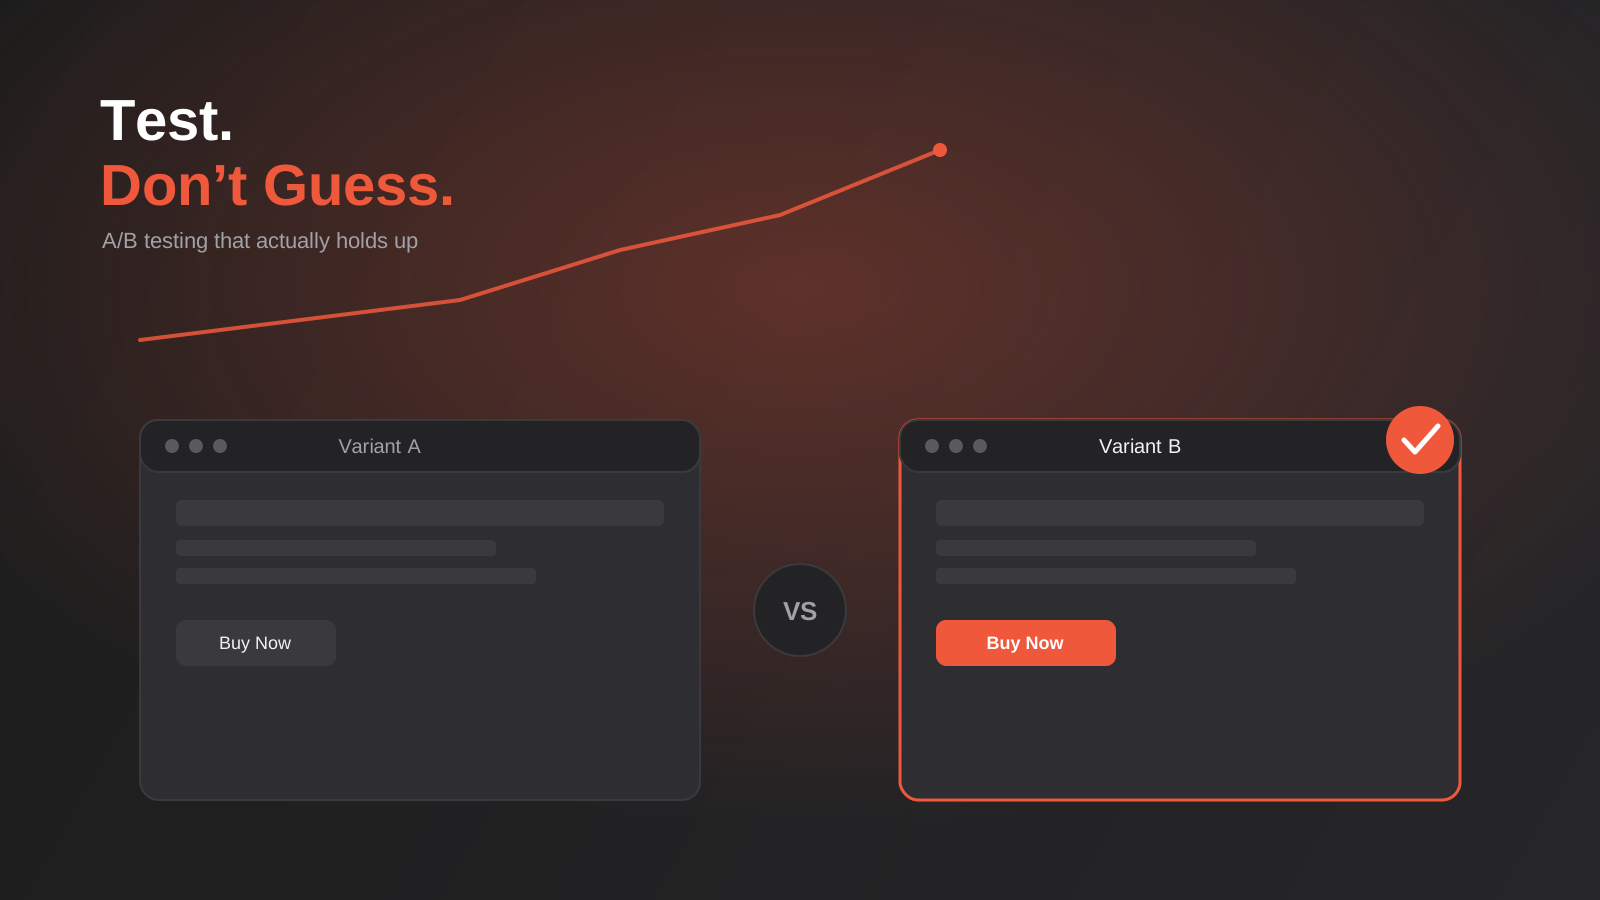
A/B Testing for Australian Websites: How to Run Tests That Actually Tell You Something (2026)
How to run A/B tests that hold up: sample size, avoiding peeking, low-traffic alternatives and building a real testing programme in Australia.
Got a project you'd like to talk through?
Tell us what you're working on — we'll come back with a plan.
