
How to Allocate Your Marketing Budget: A Practical Framework for Australian Businesses (2026)
 Jignesh Vagadiya
17/09/2026
21 min read
Every few weeks someone asks us the same question in slightly different words: “How much should we actually be spending on marketing?” It usually comes after they’ve read three blog posts quoting three different percentages, spoken to two agencies with two different answers, and looked at their bank balance for a number that feels less arbitrary than picking one out of the air.
There isn’t a single correct percentage, and any post that gives you one figure without asking about your business stage, margins or growth targets is guessing. What there is, though, is a workable marketing budget allocation framework: a way to land on a starting number, split it sensibly across channels, and know when to change it. That’s what this post covers — not a magic ratio, but the actual process we walk clients through when they’re building a marketing budget from scratch or trying to fix one that isn’t working.
If you’ve already got a budget and just want to know what things cost, our digital marketing pricing guide breaks down real 2026 figures for SEO, Google Ads, Meta Ads and web development. This post is a layer above that — it’s about how much of your revenue should go toward marketing in the first place, and how to divide it once you know.
How Much Should You Actually Spend?
The honest answer is “it depends,” but that’s not useful on its own, so here’s the range we work with and why it moves around so much.
Most benchmarking studies put a healthy marketing spend somewhere between 5% and 10% of revenue for an established Australian small or mid-sized business. That figure sits well above what most local SMEs are actually doing — industry benchmarking data has repeatedly found the average Australian and New Zealand SME spends closer to 2–3% of revenue on marketing, well under the global benchmark of around 7.7%. If your business is in that 2–3% bracket and wondering why growth has stalled, that gap is often the first place to look.
The number moves depending on three things: how established you are, how competitive your category is, and whether you’re trying to hold market share or take it from someone else.
By business stage
A new business or a new product line needs to spend more, proportionally, because it’s starting from zero brand recognition and zero search visibility. Businesses in an aggressive growth phase — new market entry, funded expansion, a fresh location — commonly sit in the 10–20% range, sometimes higher in year one if the goal is to establish a market position quickly rather than grow efficiently.
A growth-stage business that already has some traction, existing customers and a functioning website usually sits somewhere in the middle: 7–12% of revenue is a reasonable working range while you’re still actively expanding.
A mature, stable business with a steady customer base and repeat revenue can often run efficiently on 4–7%, because a chunk of the job has shifted from acquisition to retention, and retention is cheaper than acquisition in almost every category we work in.
By industry and business model
A B2B services business with long sales cycles and high customer lifetime value can often run leaner — 3–5% of revenue — because each customer is worth more and word of mouth and referral still carry real weight. An ecommerce brand competing on paid acquisition against dozens of near-identical competitors usually needs to run hotter, often 10–15%, because customer acquisition cost is a constant, visible line item rather than something that happens in the background.
Local service businesses — trades, healthcare, hospitality — sit somewhere in between, and the number is often more about local competition density than business model. Two plumbers in different suburbs can have wildly different “right” marketing budgets depending on how many competitors are already bidding on the same keywords.
Professional services with regulatory constraints — legal, healthcare, finance — often sit lower again, not because demand is weaker but because some of the highest-intent, lowest-cost channels (referral, reputation, word of mouth) do more of the heavy lifting and paid acquisition has to work around advertising rules the rest of the market doesn’t face. Non-profits are a genuine outlier: marketing budget there is often framed as a percentage of the fundraising or program target rather than revenue, and boards can be understandably wary of a number that looks large next to program spend, even when it’s the thing keeping donations flowing.
The Channel Split: Where the Money Actually Goes
Once you’ve got a top-line number, the next question is how to divide it. This is where most budgets go wrong — not because the total is off, but because it’s all pointed at one or two channels with no structure behind the allocation.
The 70/20/10 approach
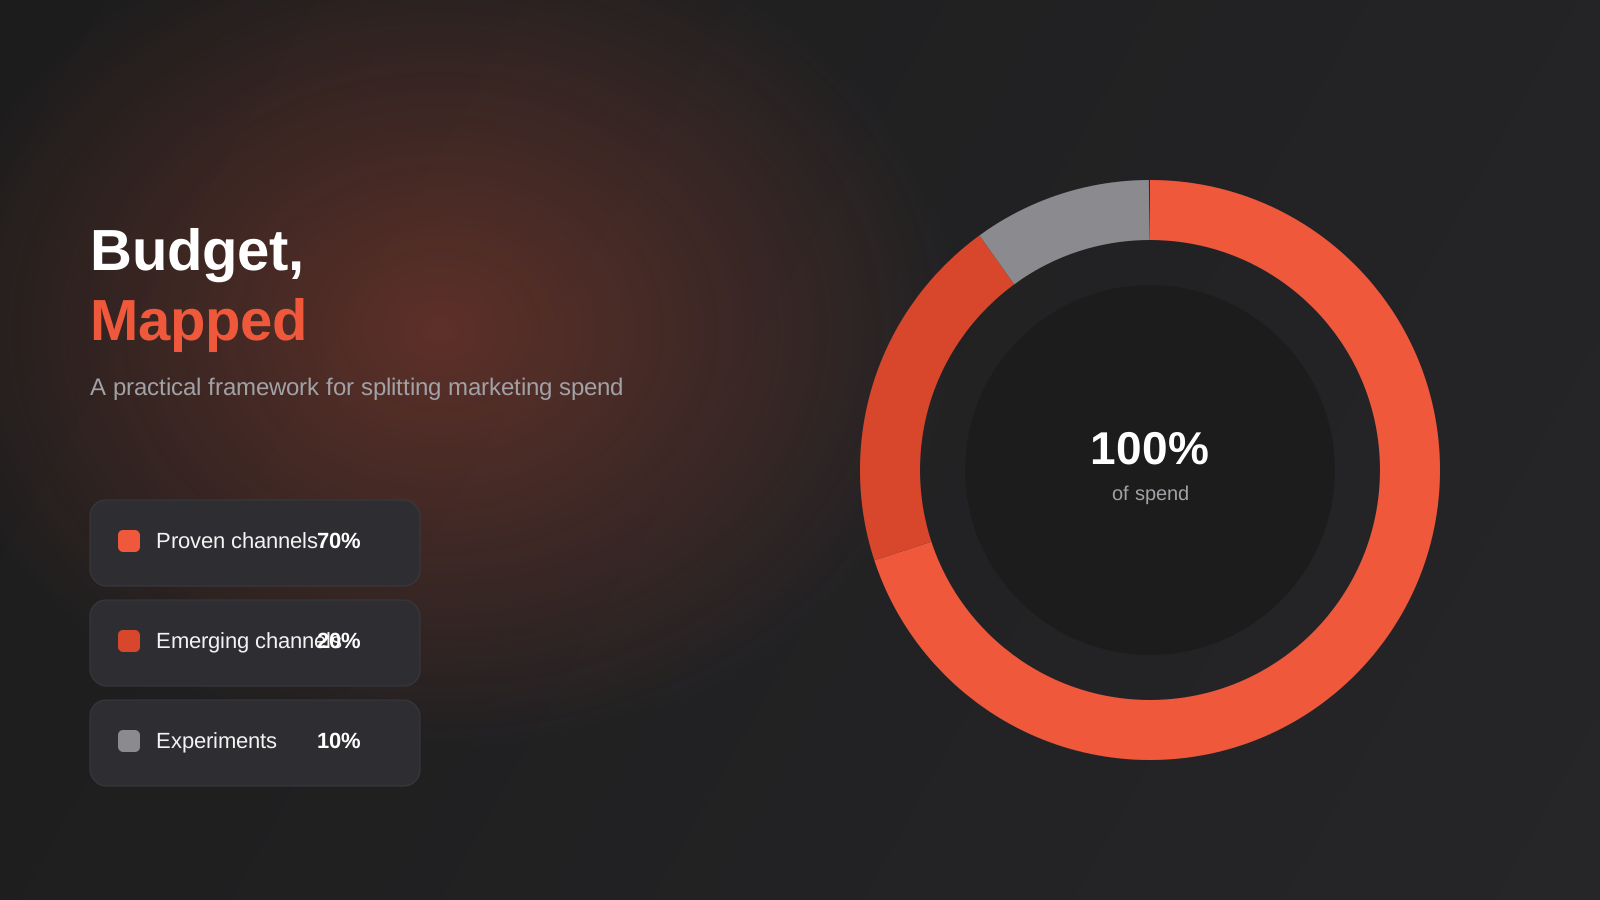
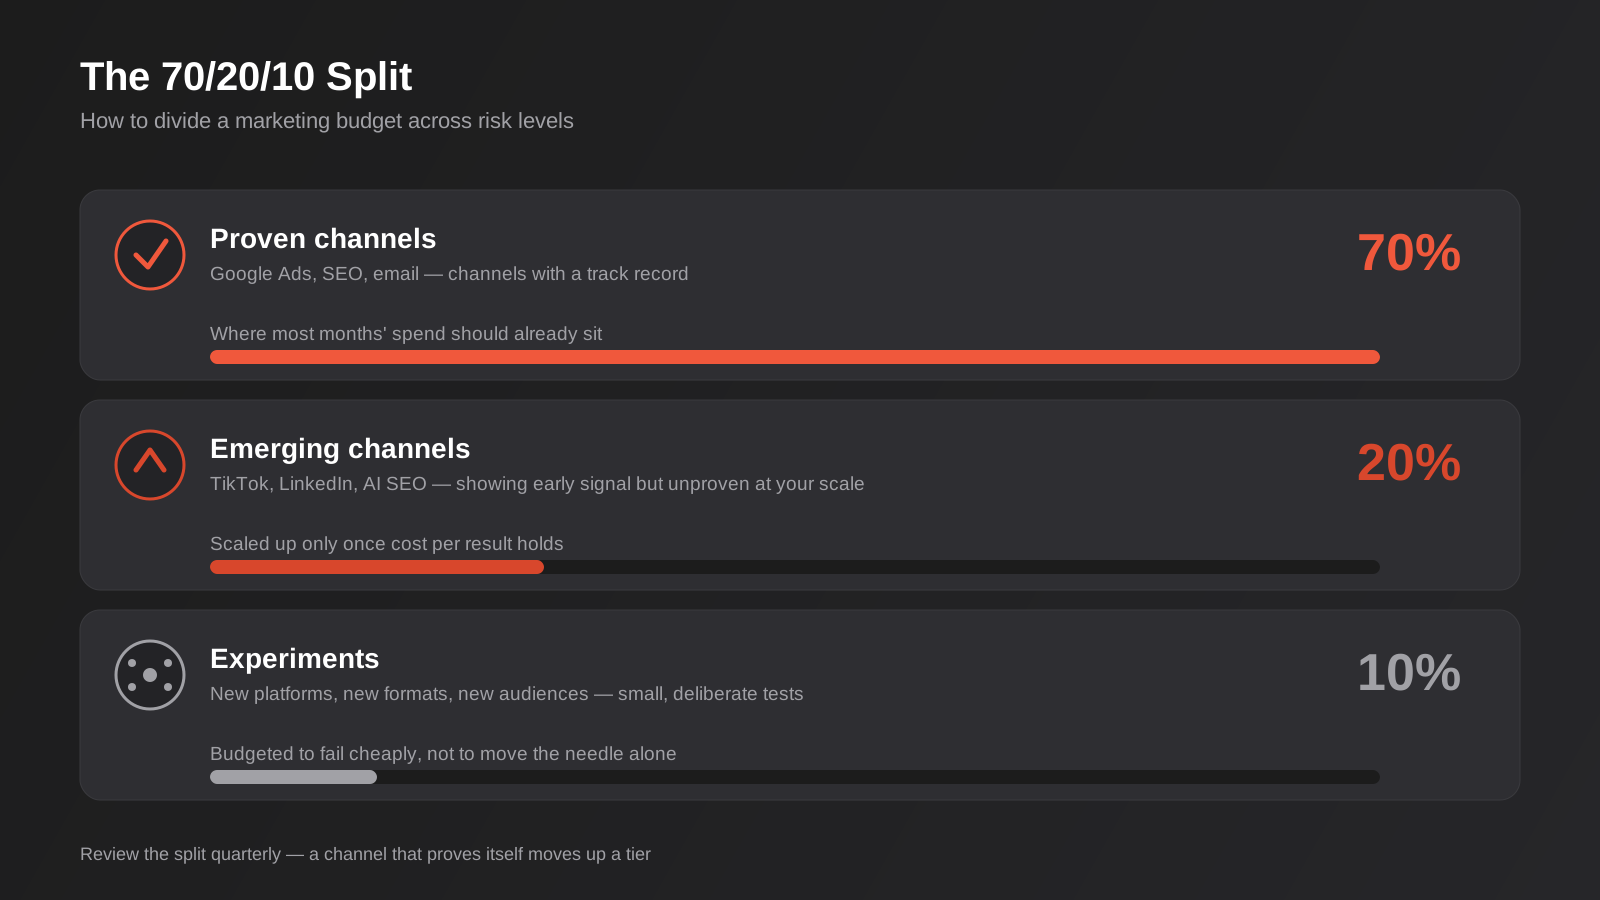
We lean on a version of the 70/20/10 framework that a lot of performance marketers use, because it forces a useful discipline: most of the budget goes to what’s already working, a meaningful chunk goes to things with early signal but no track record yet, and a small slice is set aside purely to test.
Seventy percent goes to proven channels — for most of our clients that’s Google Ads, SEO and email, because they have a track record in your account or your category and you can forecast a result with reasonable confidence. Twenty percent goes to channels showing promise but not yet proven at your scale — that might be a new social platform, a new ad format, or a channel that’s working well for a competitor. Ten percent is genuinely experimental spend: small, deliberate tests you expect to fail more often than they succeed, budgeted specifically so a failure doesn’t hurt.
The point of the split isn’t the exact numbers — it’s the principle that a channel has to earn its way from the 10% bucket into the 20%, and from the 20% into the 70%, based on performance you can actually measure. Nothing skips straight to the top of the budget because someone read a case study.
A practical starting split by function
If 70/20/10 feels too abstract to act on this week, a second way to think about it is by function rather than risk tier: how much goes to acquisition, how much to retention, and how much to brand-building that doesn’t convert directly but keeps you top of mind.
A workable starting point for a lot of small and mid-sized Australian businesses looks roughly like this: 45–55% on performance channels that generate leads or sales directly (Google Ads, paid social, local SEO), 20–30% on retention and lifecycle (email, SMS, loyalty, remarketing to existing customers), and 20–30% on brand and content that builds long-term visibility (organic social, content marketing, PR, sponsorships). Ecommerce brands typically weight performance higher; B2B and high-LTV service businesses typically weight retention and content higher, because the sales cycle rewards being visible and credible over months, not days.
Building Your Budget from Zero
If you’ve never set a formal marketing budget before, or you’re starting a new financial year and want to do it properly rather than just rolling last year’s number forward, here’s the order we’d actually work through it in.
Step 1: Start from revenue, not from a wish list
Work out your baseline revenue figure — trailing twelve months is usually more reliable than a single quarter, especially if your business has any seasonality. Apply the percentage range that fits your stage and industry from the sections above. This gives you a top-line number before a single dollar is allocated to a channel, which matters because it stops the budget being built bottom-up from “what we think each channel should cost,” a process that reliably ends up higher than what the business can actually support.
Step 2: Separate media spend from service fees
This is the step people skip most often, and it causes real confusion later. Your marketing budget has two very different components: the money that goes to platforms (Google, Meta, LinkedIn) as ad spend, and the money that goes to the people or agency running the work. Treating them as one blended number makes it almost impossible to know whether a channel is genuinely underperforming or whether the management fee is just eating a disproportionate share of a small budget. Our digital marketing pricing guide, linked above, has real fixed-fee figures for Australian SEO, Google Ads and web project costs if you want a reference point for the service-fee side of this split.
Step 3: Allocate by channel, using the 70/20/10 lens
With a top-line number and a clean media/fees split, allocate across channels using the proven/emerging/experimental framework above. Be specific: don’t write “social media, $X” — write which platform, what it’s for (awareness, retargeting, lead gen), and what result would justify keeping it in next quarter’s plan.
Step 4: Hold back a genuine contingency
Set aside 5–10% of the total budget that isn’t pre-assigned to anything. Markets move — a competitor launches an aggressive campaign, a platform changes its algorithm, a seasonal spike arrives earlier than expected — and a budget with zero slack means every response requires cutting something else first. That delay is often the difference between capturing an opportunity and watching a competitor capture it instead.
Two worked examples
Numbers land better with a concrete example, so here are two, deliberately different, to show how the same framework produces very different budgets.
A Sydney electrical contractor turning over roughly $1.2 million a year, established for six years with steady repeat and referral work, sits at the mature end of the range: 5% of revenue, or $60,000 a year, or $5,000 a month. Inside the 70/20/10 split, that’s roughly $3,500 a month on proven channels — local SEO and a tightly targeted Google Ads campaign around service-area suburbs — $1,000 on an emerging channel like Google Local Services Ads, and $500 held for genuine tests such as a seasonal offer on a new platform. Service fees and ad spend are tracked as two separate lines inside that $5,000, not folded together.
A newly launched Melbourne DTC skincare brand with $400,000 in projected first-year revenue sits at the aggressive-growth end: 15% of projected revenue, or roughly $5,000 a month early on, rising as revenue builds through the year. Because there’s no existing audience or search visibility yet, more of that budget sits in paid acquisition and content than the mature example above — closer to 60% performance, 20% retention (email flows from day one, since first-time customers are the cheapest list to build), and 20% brand and content, with the 70/20/10 channel-risk split still applied inside the performance slice as specific platforms get tested against each other.
A third example sits in between: a Brisbane-based B2B software company on $3 million ARR, three years post-launch, with a functioning sales team but still actively taking market share. That’s growth-stage territory: 9% of revenue, roughly $270,000 a year or $22,500 a month. Given the longer B2B sales cycle, the function split leans further toward content and retention than the skincare example — around 40% performance (LinkedIn Ads, Google Ads for high-intent terms), 25% retention (email nurture sequences and a customer marketing program aimed at expansion revenue from existing accounts), and 35% brand and content (a genuine content program, LinkedIn organic, webinars), because in B2B software the content and thought-leadership investment is often what gets a prospect to take the sales call in the first place, well before any paid channel gets credit for the conversion.
Neither number is more “correct” than the other — they’re both correct for the business they belong to, which is really the whole point of working from a framework instead of a single rule of thumb.
When to Shift the Split
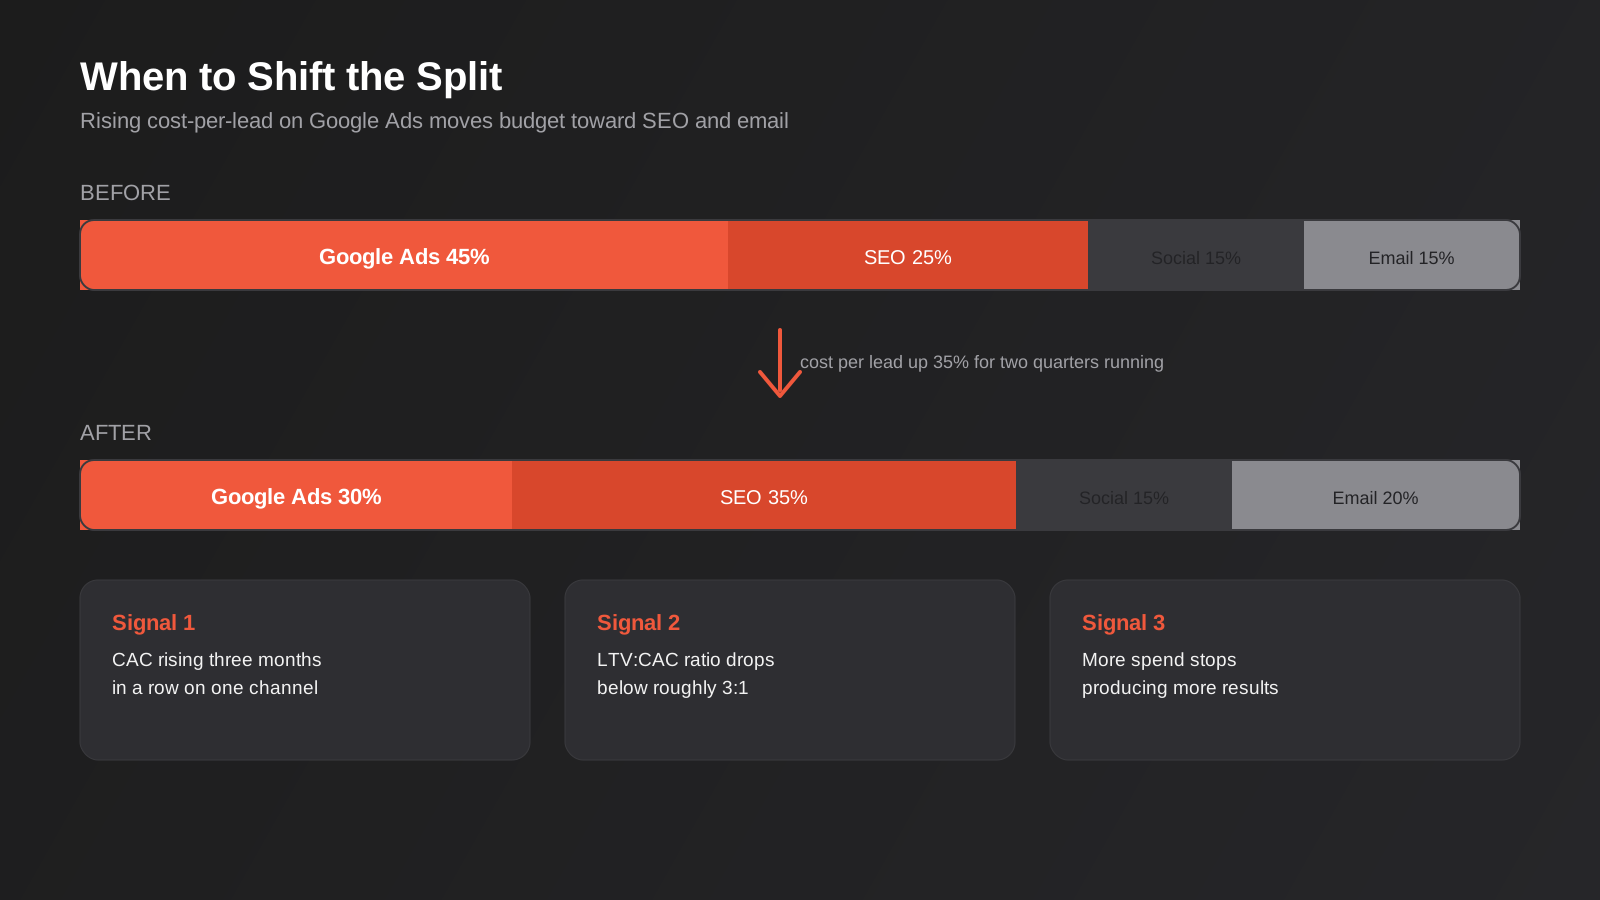
A budget set once a year and never revisited is one of the most common ways we see marketing spend quietly go to waste. Channels don’t stay equally efficient forever — a Google Ads account that was cheap eighteen months ago can get more expensive as competitors enter the auction, while an SEO investment that looked slow at first can start compounding once content and authority build up. The budget should move with that reality, not stay frozen against a plan written in a different market.
There are three signals worth watching on a monthly basis, because any one of them on its own is normal noise, but two or three together over a sustained period usually means it’s time to reallocate.
Customer acquisition cost (CAC) rising for three months in a row on one channel while other channels stay flat is the clearest signal. A single expensive month can be a fluke — a competitor running a promotion, a seasonal dip in demand. Three months running is a trend, and it usually means that channel has become less efficient at your current spend level, not that the whole strategy has failed.
Your LTV:CAC ratio drops below roughly 3:1. As a rule of thumb, a customer should be worth at least three times what it costs to acquire them for the channel to be sustainably profitable once you account for delivery costs, churn and overheads. When that ratio compresses, it’s worth checking whether the channel itself has gotten more expensive or whether the offer and landing page have stopped converting as well — the fix is different depending on which one it is.
More spend stops producing more results. Every channel eventually plateaus — there’s a ceiling on how much a given audience, keyword set, or ad inventory can absorb before returns diminish. Recognising that ceiling and moving the next dollar to a channel with more headroom, rather than continuing to push a saturated one, is often worth more to overall performance than any single optimisation inside that channel.
Attribution: Making Sure You’re Measuring the Right Channel
A budget can be well built and still get moved in the wrong direction if the data underneath it is misleading. Attribution — deciding which channel gets credit for a conversion — is the part of this process most businesses either ignore or get wrong by default, and it quietly undermines every decision built on top of it.
Last-click bias skews the picture
Most analytics setups default to last-click attribution, which gives 100% of the credit for a sale to whatever channel the customer clicked immediately before converting. That systematically overstates channels that catch people at the very end of their decision — branded search, retargeting, direct traffic — and understates the channels that did the work of creating awareness and consideration earlier on, like organic social, content, or a first-touch display ad. Left unchecked, last-click reporting can talk you into cutting the channel that’s actually generating demand in favour of the channel that’s just harvesting it.
Platform-reported numbers rarely agree with each other
Google Ads, Meta and your CRM will each claim credit for overlapping conversions, and if you add up every platform’s self-reported results you’ll usually get a number well above what actually happened in the bank account. That’s not fraud, it’s just how independent tracking systems work — each one sees its own touchpoint and assumes it mattered most. The fix isn’t to distrust every platform equally; it’s to treat platform dashboards as directional and reconcile them monthly against a single source of truth, usually actual sales or leads recorded in your CRM, so the budget conversation is grounded in what genuinely closed rather than what four different dashboards each claim.
Keep it simple before making it sophisticated
You don’t need a full multi-touch attribution model to make good budget decisions — most small and mid-sized businesses never will, and the tooling to do it properly is expensive relative to what it adds. Consistent UTM tagging on every campaign link, a lead-source field captured at the point of enquiry, and a monthly reconciliation between platform-reported results and actual closed revenue will catch the vast majority of the distortion last-click and platform-siloed reporting introduces. Get that basic hygiene right before investing in anything more advanced.
Reviewing and Reporting the Budget
A budget is only as useful as the reporting that sits behind it. If you can’t see channel-level cost per result, blended cost per acquisition and rough LTV by customer segment, you’re allocating based on gut feel with extra steps — which is the exact problem this framework is meant to solve.
We’d recommend a monthly check-in on the numbers — not necessarily a full strategy review, but enough to catch the CAC and plateau signals early — and a proper quarterly review where you actually look at moving budget between tiers. Annual-only reviews are too slow; by the time you notice a channel has been underperforming for eleven months, you’ve wasted most of a year’s efficiency on it. If building that reporting layer by hand in spreadsheets is eating more time than the analysis itself, it’s usually a sign the reporting needs to be automated rather than the review cadence relaxed.
Keep expectations realistic while you’re reviewing, too. SEO and content investments take months to show their full return, while paid channels show results within weeks — comparing them on the same monthly report without adjusting for that lag is one of the more common reasons budgets get pulled from a channel just before it was about to pay off. We cover this timing mismatch in more detail in our post on what actually happens when you invest in digital marketing.
Adjusting the Budget for Seasonality and Cash Flow
An annual percentage is a useful planning number, but very few Australian businesses actually earn revenue in twelve even instalments, and a marketing budget that’s spread flat across the calendar regardless of demand usually wastes money in the quiet months and under-invests in the busy ones.
Retail and ecommerce are the obvious case — a disproportionate share of annual revenue lands in the run-up to Christmas and the Boxing Day to January sale period, and budgets that don’t front-load spend into October and November to build audiences and retargeting lists before that window are leaving demand on the table. The reverse applies too: pulling budget right back in the quieter months rather than maintaining a flat spend protects margin without meaningfully hurting results, since demand itself is lower.
B2B and professional services often see the opposite seasonal pattern — a lot of Australian businesses push hard to close projects before EOFY at the end of June, and again see a pickup in enquiries in late January and February as businesses return from the holiday break with new-year budgets to spend. Trades and construction has its own rhythm again, often slower over the December–January holiday period and picking back up through autumn and spring. The point isn’t that any one pattern is universal — it’s that your budget should be built against your own historical demand curve, not spread evenly across the calendar by default.
For businesses with genuinely lumpy cash flow, it’s also worth separating the marketing budget conversation from the cash flow conversation. The percentage-of-revenue figure is still the planning target, but committing to spend it in twelve equal instalments regardless of when the cash actually lands can strain a business that earns most of its revenue in a four-month window. Aligning spend timing to cash flow, while still hitting the annual target, avoids that strain without abandoning the plan.
Common Mistakes We See
- Copying a percentage from a blog post or a competitor without adjusting for business stage, margin or category competitiveness.
- Setting the budget once a year and treating it as fixed, even as channel performance visibly shifts month to month.
- Blending media spend and service fees into one number, which makes it impossible to tell whether a channel or the management of it is underperforming.
- Running an entirely performance-weighted budget with nothing in retention or brand, which works until acquisition costs rise and there’s no cheaper channel to fall back on.
- Cutting a channel’s budget the moment results dip, instead of diagnosing whether the issue is cost, creative, targeting or the landing page it points to.
- Leaving zero contingency, so every unplanned opportunity or threat has to be funded by cutting something else first.
- Judging a content or SEO investment against the same monthly timeline as a paid channel, then pulling funding right before it compounds.
- Relying on last-click, platform-reported numbers to decide where to cut, when those numbers routinely overstate bottom-of-funnel channels and understate the ones building demand earlier.
- Spreading spend flat across the calendar for a business with a genuinely seasonal demand curve, instead of front-loading budget ahead of the periods that actually convert.
Frequently Asked Questions
What percentage of revenue should a small business spend on marketing in Australia?
Most established small businesses do well in the 5–10% of revenue range, with newer businesses or those in aggressive growth phases often needing 10–20% and mature, stable businesses able to run closer to 4–7%. Australian SMEs tend to under-spend relative to this benchmark, with industry data putting the average closer to 2–3% of revenue — well below what’s typically needed to grow.
Should agency fees be included in the marketing budget percentage?
Yes, but keep them as a separate line item rather than blending them into media spend. Your total marketing budget percentage should cover both ad spend and the cost of the people or agency managing it, but reporting on them separately is the only way to tell whether a channel is underperforming because of cost, or because of how it’s being run.
How much of the budget should go to SEO versus paid ads?
There’s no fixed ratio, but a common working split for established businesses puts more weight on paid channels for immediate lead flow and a growing share into SEO as it builds authority and starts producing cheaper, compounding traffic. Businesses with tighter margins or longer sales cycles often shift the balance toward SEO and content over time, since the cost per lead tends to fall as rankings mature, while paid stays roughly flat.
How often should you review and adjust marketing budget allocation?
A monthly check on core performance signals — cost per lead, cost per acquisition, channel-level trends — catches problems early, while a proper quarterly review is where you actually move budget between channels. Reviewing only once a year is too slow to catch a channel that’s been quietly underperforming for months.
What’s a realistic marketing budget for a business just starting out?
New businesses typically need to spend at the higher end of the range, often 15–20% of projected revenue in the first year or two, because there’s no existing brand recognition, organic search visibility or repeat customer base to lean on. That figure should taper down as the business builds those assets and can rely less on paid acquisition for every new customer.
Does the 70/20/10 rule work for small budgets?
It scales down fine in principle, but very small monthly budgets sometimes can’t meaningfully split into three tiers without each slice being too small to produce a readable result. In that case, it’s often better to run 100% in the proven-channel tier until the budget is large enough to fund a genuine test alongside it, rather than spreading an already-thin budget even thinner.
Where to Start
If you’re setting a marketing budget for the first time, start with the revenue percentage range for your stage, separate media spend from service fees, and build the 70/20/10 split before you touch a single platform’s ad manager. If you’ve already got a budget but the split feels like it was set a while ago and never revisited, the CAC and plateau signals above are a reasonable place to start checking.
We work through exactly this process with clients before we ever propose a specific channel mix — it’s a conversation about your numbers first, our recommendations second. Bring your last twelve months of revenue, whatever channel-level performance data you’ve got even if it’s incomplete, and a rough sense of your growth target for the year ahead, and a proper budget conversation is usually possible in a single meeting rather than weeks of back and forth.
If you want a second opinion on how your current budget is split, or you’re working out what a realistic number looks like for your business for the first time, our pricing page has current fixed costs across every service, and we’re happy to talk through where your budget should actually be going.
Keep reading
Related posts

Digital Marketing for Car Dealerships and Workshops in Australia (2026)
Digital marketing for Australian car dealerships and workshops: local SEO, Google Ads, booking flows, and the price-advertising rule every dealer must follow.
Digital Marketing for Australian Manufacturers: Turning Visitors Into RFQs (2026)
How Australian manufacturers turn website visits into RFQs: capability pages, product SEO, LinkedIn Ads for procurement buyers, and quote automation.
Marketing for Recruitment Agencies in Australia: Winning Both Clients and Candidates
Recruitment agencies sell to two audiences at once. How SEO, LinkedIn Ads, job board strategy and compliance need to split between employers…
Got a project you'd like to talk through?
Tell us what you're working on — we'll come back with a plan.
